Where AI chat loses the sale: the WisWes conversation funnel
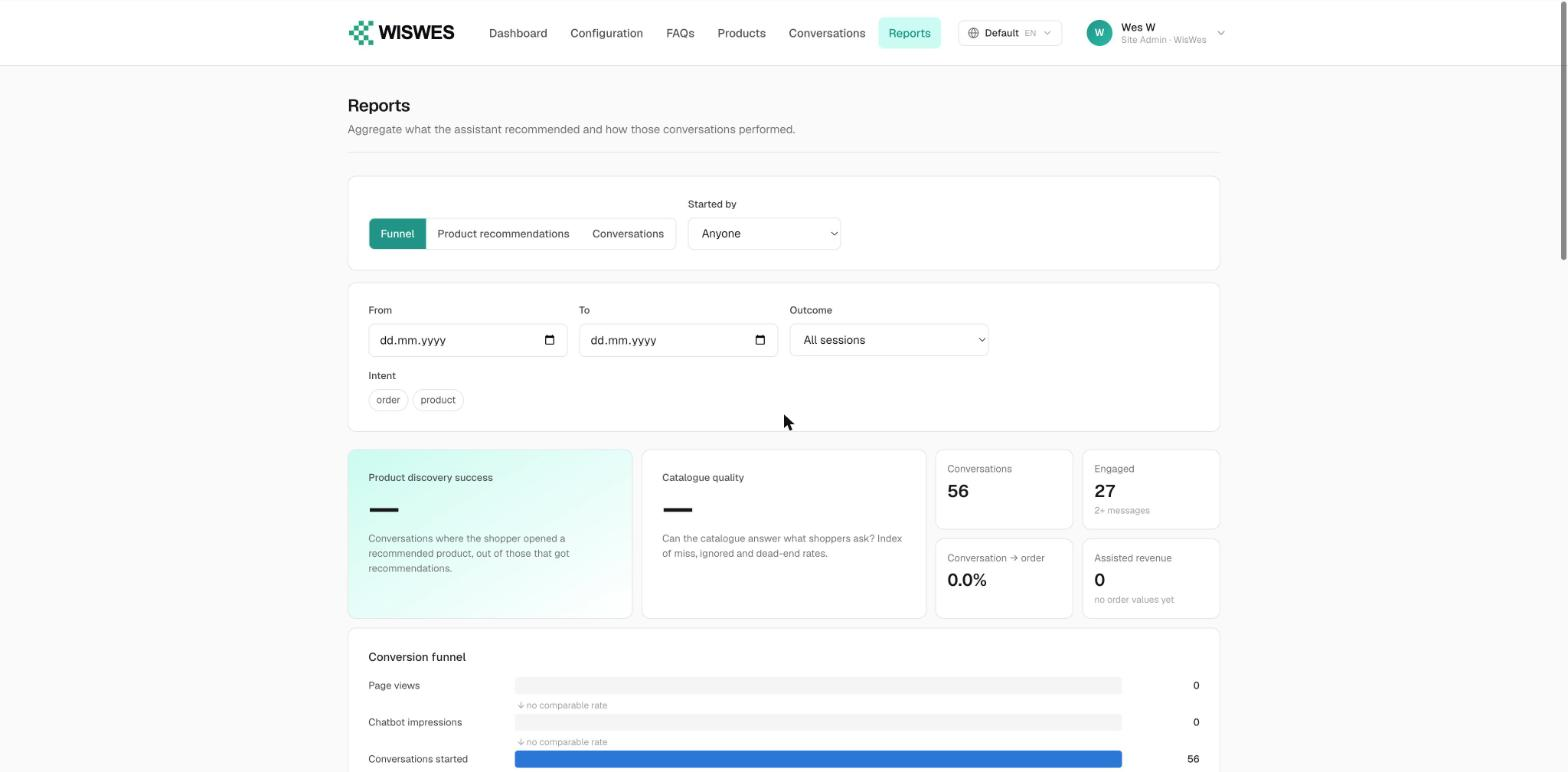
WisWes Reports answers one question: at which step does a chat conversation stop turning into an order? It lays every conversation on an eight-step funnel, from page views down to completed orders, and shows how many shoppers were lost between each pair of steps. The point is not another dashboard. The point is that “conversations are up” and “revenue is up” are different sentences, and until you can see the steps between them you cannot tell which one you are actually looking at.
The eight steps
A shopper clears a lot of small hurdles between landing on your store and buying something through chat. Most analytics collapse all of that into one conversion number, which tells you something is broken without telling you what. The funnel keeps the hurdles separate:
| Step | What it counts |
|---|---|
| Page views | Storefront pages where the widget was present |
| Chatbot impressions | Times the widget was actually seen |
| Conversations started | Someone sent a first message |
| Engaged conversations | More than one message exchanged |
| Product recommendations | The assistant put products in front of them |
| Product clicks | They opened one of those products |
| Add to cart | The product reached the cart |
| Orders | The purchase completed |
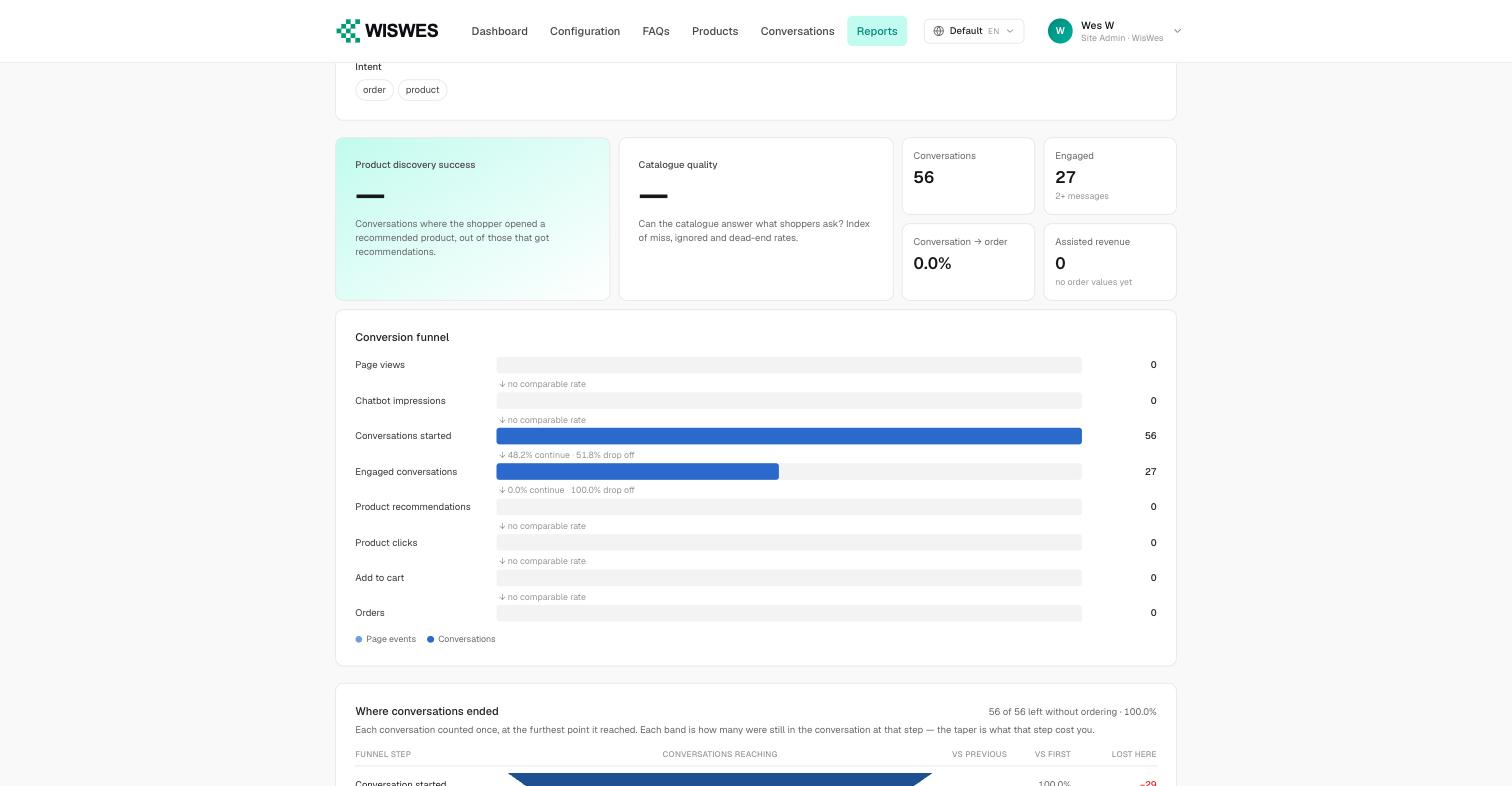
The first two steps come from storefront traffic. The remaining six come from the conversations themselves. That split matters more than it looks, and it is the reason for the next section.
Why the funnel sometimes refuses to show a percentage
Look at the screenshot above. Several rows read “no comparable rate” instead of a number, and that is deliberate.
Page-view capture starts the day you install the widget. Conversation history is often older — imported, migrated, or simply collected before analytics was wired up. Divide one by the other and you get an adoption rate of 5,400%: two hundred conversations from four page views. Most tools print that number without blinking.
The rule we chose
When the traffic stream is younger than the conversations being counted, WisWes suppresses the cross-stream rate instead of printing it. The counts are still shown, because the counts are true. It is only the ratio between two streams of different ages that is not.
A blank is more useful than a lie. A dashboard that always fills every cell teaches you to distrust all of them equally; one that admits the gap keeps the rest of its numbers worth reading.
Where conversations actually die
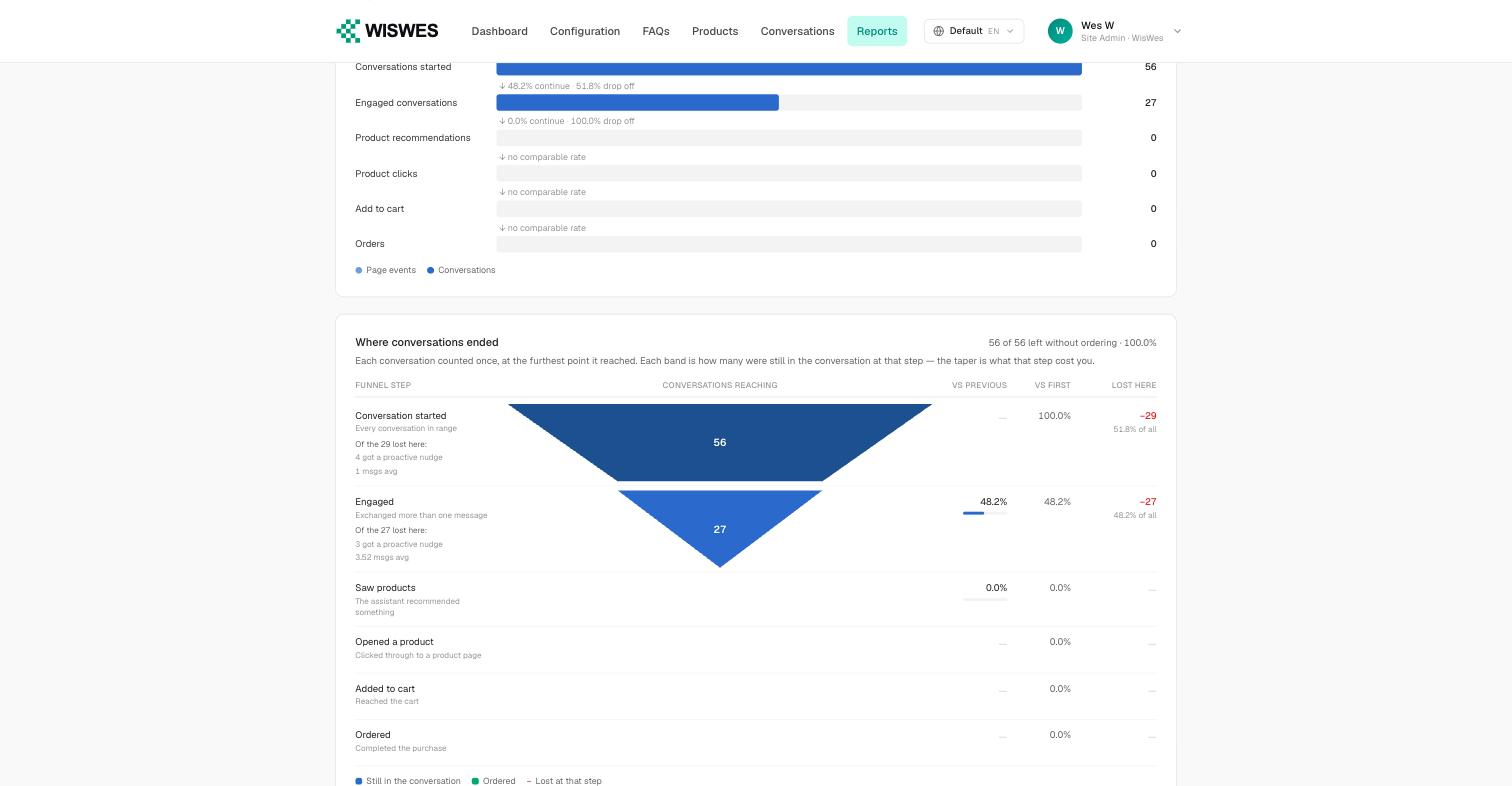
The funnel shows how many made it through each step. The exit breakdown shows the opposite: every conversation counted once, at the furthest point it reached. The taper is what each step cost you.
| Exit bucket | Reading |
|---|---|
| Conversation started | One message and gone — the opener is not landing |
| Engaged | They talked, but nothing was ever recommended |
| Saw products | Recommendations appeared and were ignored |
| Opened a product | Interest was real; the product page lost them |
| Added to cart | A checkout problem, not a chat problem |
| Ordered | Completed |
Each bucket points at a different owner. A pile-up at Engaged is a retrieval or intent problem. A pile-up at Added to cart means chat did its job and checkout did not. Without the split, both look identical in a single conversion number — and teams spend a quarter tuning prompts to fix a shipping-cost problem.
Two details make this section unusually diagnostic. Each row shows how many of the lost conversations had received a proactive nudge, and the average message count at that exit. “Ended after 1 message on average” and “ended after 3.5” are different failures: the first is an opener nobody wanted, the second is a conversation that tried and ran out of road.
The KPI groups
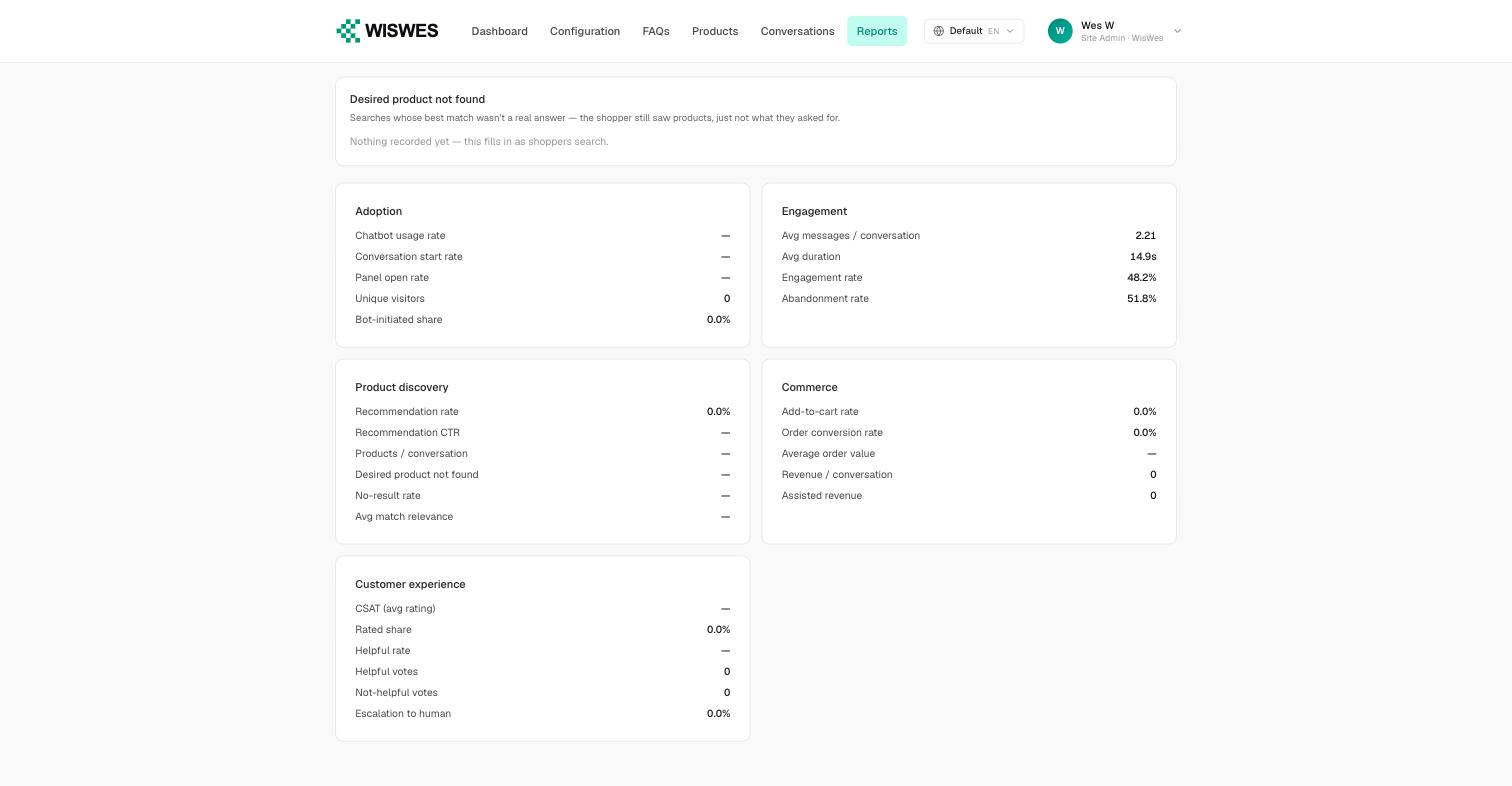
Below the funnel, five groups cover the whole lifecycle. This is where you go once the funnel has told you which step to care about.
| Group | Answers |
|---|---|
| Adoption | Are shoppers finding and opening the assistant at all? |
| Engagement | Messages per conversation, duration, engagement vs abandonment |
| Product discovery | Recommendation rate and CTR, desired-product-not-found, match relevance |
| Commerce | Add-to-cart, order conversion, AOV, revenue per conversation, assisted revenue |
| Customer experience | CSAT, rated share, helpful votes, escalation to human |
Note the distinction between a dash and a zero. Zero means it happened zero times. A dash means there is not enough data to say. Reading a dash as a zero is how teams conclude a feature is broken when it simply has not been measured yet.
Which products the assistant actually pushes
The second view reports the catalogue side: impressions, clicks, add-to-cart, sessions reached and converted sessions, per product.
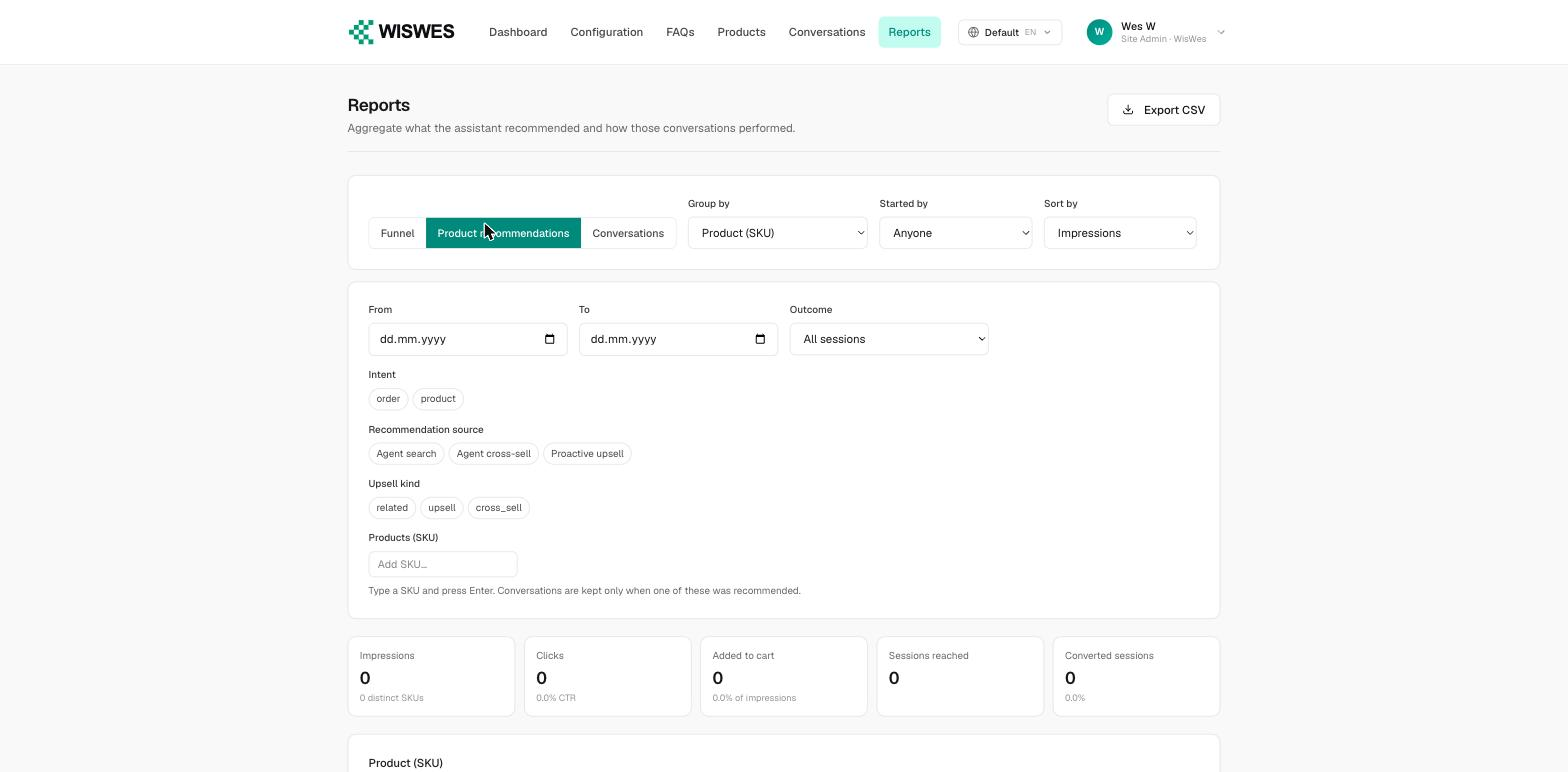
Two filters here earn their place. Recommendation source separates agent search from agent cross-sell and proactive upsell — three very different motions that a blended CTR would average into meaninglessness. Upsell kind splits related, upsell and cross-sell. And slider position as a grouping answers a question every merchandiser eventually asks: does anyone scroll past the first two products?
Volume, outcome and cost
The third view groups conversations by any dimension you like and reports volume, conversion, win-backs, rating, messages, tokens and duration.
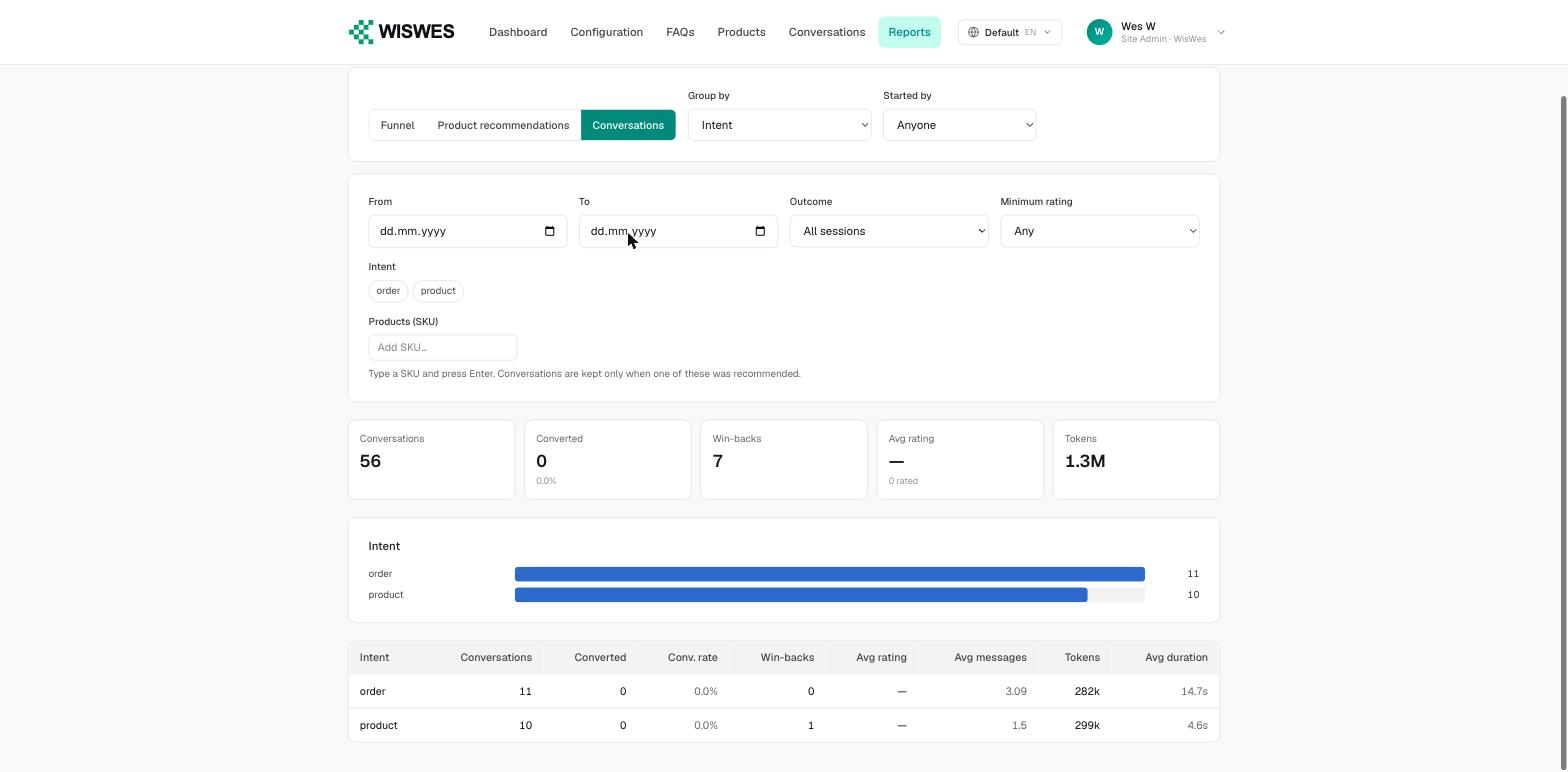
The token column is the one people overlook. It is the cost side of the ledger sitting next to the revenue side, grouped the same way, so you can see which intent is expensive and whether it earns it. An intent burning 300k tokens at a 0% conversion rate is a prompt or a flow to fix, not a line item to accept.
The filters
Every view shares a filter bar, so you can narrow without exporting anything: date range, outcome (all sessions, converted, abandoned), intent, products by SKU, minimum rating, and started by.
That last one is the quiet lever. Proactive conversations and shopper-initiated ones behave nothing alike, and averaging them hides both. Split by Started by and you can finally see whether the nudge earns its interruption.
How to read it in ten minutes
- Set the date range to a period with real traffic. Funnels need volume before they mean anything.
- Find the biggest single drop between two adjacent steps. That is your constraint; everything else is noise until it moves.
- Open the exit breakdown for that step and check the average message count. It tells you whether people gave up immediately or tried first.
- Split by intent. Order-intent and product-intent conversations fail in different places, and the blended funnel hides both.
- Change one thing. Come back with the same filters. If you changed the prompt and the copy and the promo at once, the funnel cannot tell you which one worked — that is what A/B testing is for.
FAQ
What does WisWes Reports measure?
The path from storefront traffic to completed orders through chat, in eight steps: page views, chatbot impressions, conversations started, engaged conversations, product recommendations, product clicks, add to cart, and orders — plus a breakdown of which step each conversation ended on.
Why does a rate show “no comparable rate” instead of a number?
Because the two streams being divided cover different periods. When page-view capture is younger than the conversation history, any adoption rate computed from them is meaningless, so WisWes suppresses the rate and keeps the raw counts.
What is the difference between a dash and a zero?
A zero means the event happened zero times. A dash means there is not enough data to compute the metric honestly. They look similar and mean opposite things.
Can I export the data?
Yes. The recommendation and conversation views both export to CSV with the current filters and grouping applied.
Do I need extra tracking code?
No. The conversation steps come from the assistant itself. The two traffic steps come from the widget already running on your storefront.
The short version
Chat either moves shoppers toward a purchase or it does not, and a single conversion number cannot tell you which step is doing the losing. The funnel names the step. The exit breakdown names the owner. And when the data cannot support a number honestly, the page says so instead of inventing one.